CMS 3D CMS Logo

 All Classes Namespaces Files Functions Variables Typedefs Enumerations Enumerator Properties Friends Macros Pages
List of all members | Public Member Functions | Private Attributes
LEPBandPlot Class Reference

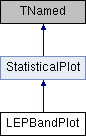
LEPBandPlot: The plot for the CL bands "a la LEP". More...

#include <LEPBandPlot.h>

Inheritance diagram for LEPBandPlot:
StatisticalPlot

Public Member Functions

void draw (const char *options="")
 Draw on canvas. More...
 
void dumpToFile (const char *RootFileName, const char *options)
 All the objects are written to rootfile. More...
 
 LEPBandPlot (const char *name, const char *title, const int n_points, double *x_vals, double *sb_vals, double *b_vals, double *b_rms, double *exp_vals=0)
 Constructor. More...
 
 LEPBandPlot (const char *name, const char *title, const int n_points, double *x_vals, double *sb_vals, double *b_vals, double *b_up_bars1, double *b_down_bars1, double *b_up_bars2, double *b_down_bars2, double *exp_vals=0)
 Constructor. More...
 
void print (const char *options="")
 Print the relevant information. More...
 
void setTitle (const char *title)
 Set the title of the plot. More...
 
void setXaxisTitle (const char *title)
 Set the title of the x axis. More...
 
 ~LEPBandPlot ()
 Destructor. More...
 
- Public Member Functions inherited from StatisticalPlot
void dumpToImage (const char *filename)
 Write an image on disk. More...
 
TCanvas * getCanvas ()
 Get the canvas. More...
 
bool is_verbose ()
 get the verbosity More...
 
void setCanvas (TCanvas *new_canvas)
 Set the canvas. More...
 
void setVerbosity (bool verbosity)
 Set the verbosity. More...
 
 StatisticalPlot (const char *name, const char *title, bool verbosity=true)
 Constructor. More...
 
 ~StatisticalPlot ()
 Destructor. More...
 

Private Attributes

TGraph * m_b_band_graph_1sigma
 The b band 1 sigma. More...
 
TGraph * m_b_band_graph_2sigma
 The b band 2 sigma. More...
 
TGraph * m_b_line_graph
 The b line. More...
 
TGraph * m_data_line_graph
 The data line. More...
 
TLegend * m_legend
 The legend. More...
 
TGraph * m_sb_line_graph
 The sb line. More...
 
TLine * m_zero_line
 The line at 0. More...
 

Detailed Description

LEPBandPlot: The plot for the CL bands "a la LEP".

Revision:
1.5
Date:
2009/09/23 19:41:22
Author
D. Piparo (danilo.piparo<at>cern.ch), G. Schott - Universitaet Karlsruhe

This class allows to produce plots like the ones of the Tevatron HWG and originally introduced by LEP HWG. It is thought as a "enhanced" TGraph. The input to give to obtain the plot are:

LEP_band_plot.png

Definition at line 41 of file LEPBandPlot.h.

Constructor & Destructor Documentation

LEPBandPlot::LEPBandPlot ( const char *  name,
const char *  title,
const int  n_points,
double *  x_vals,
double *  sb_vals,
double *  b_vals,
double *  b_rms,
double *  exp_vals = 0 
)

Constructor.

Definition at line 24 of file LEPBandPlot.cc.

References i, m_b_band_graph_1sigma, m_b_band_graph_2sigma, m_b_line_graph, m_data_line_graph, m_legend, m_sb_line_graph, m_zero_line, and NULL.

31  :
32  StatisticalPlot(name,title,false){
33 
34  // bkg hypothesis line
35  m_b_line_graph = new TGraph(n_points, x_vals, b_vals);
36  m_b_line_graph->SetLineWidth(2);
37  m_b_line_graph->SetLineStyle(2);
38  m_b_line_graph->SetFillColor(kWhite);
39 
40 
41  // bkg hypothesis band 1 sigma
42  m_b_band_graph_1sigma = new TGraphErrors(n_points, x_vals, b_vals ,0, b_rms);
43  m_b_band_graph_1sigma->SetFillColor(kGreen);
44  m_b_band_graph_1sigma->SetLineColor(kGreen);
45  m_b_band_graph_1sigma->SetMarkerColor(kGreen);
46 
47  // Make the band 2 times wider:
48  double* b_2rms = new double[n_points];
49  for (int i=0;i<n_points;++i)
50  b_2rms[i]=2*b_rms[i];
51 
52  // bkg hypothesis band 2 sigma
53  m_b_band_graph_2sigma = new TGraphErrors(n_points, x_vals, b_vals ,0, b_2rms);
54  m_b_band_graph_2sigma->SetFillColor(kYellow);
55  m_b_band_graph_2sigma->SetFillColor(kYellow);
56  m_b_band_graph_2sigma->SetLineColor(kYellow);
57  m_b_band_graph_2sigma->SetMarkerColor(kYellow);
58  m_b_band_graph_2sigma->GetYaxis()->SetTitle("-2lnQ");
59 
60  // sig+bkg hypothesis line
61  m_sb_line_graph = new TGraph(n_points, x_vals, sb_vals);
62  m_sb_line_graph->SetLineWidth(2);
63  m_sb_line_graph->SetLineStyle(4);
64  m_sb_line_graph->SetLineColor(kRed);
65  m_sb_line_graph->SetFillColor(kWhite);
66 
67  // The points of the data
68  if (exp_vals!=0){
69  m_data_line_graph = new TGraph(n_points, x_vals, exp_vals);
70  m_data_line_graph->SetLineWidth(2);
71  m_data_line_graph->SetFillColor(kWhite);
72  }
73  else
75 
76 
77  // Line for 0
78  m_zero_line = new TLine(m_b_line_graph->GetXaxis()->GetXmin(),0,
79  m_b_line_graph->GetXaxis()->GetXmax(),0);
80 
81  // The legend
82 
83  m_legend = new TLegend(0.75,0.78,0.98,0.98);
84  m_legend->SetName("Confidence Levels");
85  m_legend->AddEntry(m_b_band_graph_1sigma,"-2lnQ #pm 1#sigma");
86  m_legend->AddEntry(m_b_band_graph_2sigma,"-2lnQ #pm 2#sigma");
87  m_legend->AddEntry(m_b_line_graph,"-2lnQ_{B}");
88  m_legend->AddEntry(m_sb_line_graph,"-2lnQ_{SB}");
90  m_legend->AddEntry(m_data_line_graph,"-2lnQ_{Obs}");
91 
92  m_legend->SetFillColor(0);
93 
94  delete[] b_2rms;
95  }
int i
Definition: DBlmapReader.cc:9
TGraph * m_b_band_graph_1sigma
The b band 1 sigma.
Definition: LEPBandPlot.h:95
#define NULL
Definition: scimark2.h:8
TGraph * m_sb_line_graph
The sb line.
Definition: LEPBandPlot.h:101
TLegend * m_legend
The legend.
Definition: LEPBandPlot.h:107
TGraph * m_b_band_graph_2sigma
The b band 2 sigma.
Definition: LEPBandPlot.h:98
TGraph * m_data_line_graph
The data line.
Definition: LEPBandPlot.h:89
TLine * m_zero_line
The line at 0.
Definition: LEPBandPlot.h:104
TGraph * m_b_line_graph
The b line.
Definition: LEPBandPlot.h:92
StatisticalPlot(const char *name, const char *title, bool verbosity=true)
Constructor.
LEPBandPlot::LEPBandPlot ( const char *  name,
const char *  title,
const int  n_points,
double *  x_vals,
double *  sb_vals,
double *  b_vals,
double *  b_up_bars1,
double *  b_down_bars1,
double *  b_up_bars2,
double *  b_down_bars2,
double *  exp_vals = 0 
)

Constructor.

Definition at line 99 of file LEPBandPlot.cc.

References m_b_band_graph_1sigma, m_b_band_graph_2sigma, m_b_line_graph, m_data_line_graph, m_legend, m_sb_line_graph, m_zero_line, and NULL.

109  :
110  StatisticalPlot(name,title,false){
111 
112  // bkg hypothesis line
113  m_b_line_graph = new TGraph(n_points, x_vals, b_vals);
114  m_b_line_graph->SetLineWidth(2);
115  m_b_line_graph->SetLineStyle(2);
116  m_b_line_graph->SetFillColor(kWhite);
117 
118 
119 
120  // bkg hypothesis band 1 sigma
121  m_b_band_graph_1sigma = new TGraphAsymmErrors(n_points,
122  x_vals,
123  b_vals,
124  0,
125  0,
126  b_down_bars1,
127  b_up_bars1);
128  m_b_band_graph_1sigma->SetFillColor(kGreen);
129  m_b_band_graph_1sigma->SetLineColor(kGreen);
130  m_b_band_graph_1sigma->SetMarkerColor(kGreen);
131 
132  // bkg hypothesis band 2 sigma
133  m_b_band_graph_2sigma = new TGraphAsymmErrors(n_points,
134  x_vals,
135  b_vals,
136  0,
137  0,
138  b_down_bars2,
139  b_up_bars2);
140  m_b_band_graph_2sigma->SetFillColor(kYellow);
141  m_b_band_graph_2sigma->SetFillColor(kYellow);
142  m_b_band_graph_2sigma->SetLineColor(kYellow);
143  m_b_band_graph_2sigma->SetMarkerColor(kYellow);
144  m_b_band_graph_2sigma->GetYaxis()->SetTitle("-2lnQ");
145 
146  // sig+bkg hypothesis line
147  m_sb_line_graph = new TGraph(n_points, x_vals, sb_vals);
148  m_sb_line_graph->SetLineWidth(2);
149  m_sb_line_graph->SetLineStyle(4);
150  m_sb_line_graph->SetLineColor(kRed);
151  m_sb_line_graph->SetFillColor(kWhite);
152 
153  // The points of the data
154  if (exp_vals!=0){
155  m_data_line_graph = new TGraph(n_points, x_vals, exp_vals);
156  m_data_line_graph->SetLineWidth(2);
157  m_data_line_graph->SetFillColor(kWhite);
158  }
159  else
161 
162  // Line for 0
163  m_zero_line = new TLine(m_b_line_graph->GetXaxis()->GetXmin(),0,
164  m_b_line_graph->GetXaxis()->GetXmax(),0);
165 
166  // The legend
167 
168  m_legend = new TLegend(0.75,0.78,0.98,0.98);
169  m_legend->SetName("Confidence Levels");
170  m_legend->AddEntry(m_b_band_graph_1sigma,"-2lnQ #pm 1#sigma");
171  m_legend->AddEntry(m_b_band_graph_2sigma,"-2lnQ #pm 2#sigma");
172  m_legend->AddEntry(m_b_line_graph,"-2lnQ_{B}");
173  m_legend->AddEntry(m_sb_line_graph,"-2lnQ_{SB}");
174  if (m_data_line_graph!=NULL)
175  m_legend->AddEntry(m_data_line_graph,"-2lnQ_{Obs}");
176 
177  m_legend->SetFillColor(0);
178  }
TGraph * m_b_band_graph_1sigma
The b band 1 sigma.
Definition: LEPBandPlot.h:95
#define NULL
Definition: scimark2.h:8
TGraph * m_sb_line_graph
The sb line.
Definition: LEPBandPlot.h:101
TLegend * m_legend
The legend.
Definition: LEPBandPlot.h:107
TGraph * m_b_band_graph_2sigma
The b band 2 sigma.
Definition: LEPBandPlot.h:98
TGraph * m_data_line_graph
The data line.
Definition: LEPBandPlot.h:89
TLine * m_zero_line
The line at 0.
Definition: LEPBandPlot.h:104
TGraph * m_b_line_graph
The b line.
Definition: LEPBandPlot.h:92
StatisticalPlot(const char *name, const char *title, bool verbosity=true)
Constructor.
LEPBandPlot::~LEPBandPlot ( )

Destructor.

Definition at line 182 of file LEPBandPlot.cc.

References m_b_band_graph_1sigma, m_b_band_graph_2sigma, m_b_line_graph, m_data_line_graph, m_legend, m_sb_line_graph, m_zero_line, and NULL.

182  {
183 
184  delete m_b_line_graph;
185  delete m_sb_line_graph;
186 
187  delete m_b_band_graph_1sigma;
188  delete m_b_band_graph_2sigma;
189 
190  if (m_data_line_graph!=NULL)
191  delete m_data_line_graph;
192 
193  delete m_zero_line;
194 
195  delete m_legend;
196 
197  }
TGraph * m_b_band_graph_1sigma
The b band 1 sigma.
Definition: LEPBandPlot.h:95
#define NULL
Definition: scimark2.h:8
TGraph * m_sb_line_graph
The sb line.
Definition: LEPBandPlot.h:101
TLegend * m_legend
The legend.
Definition: LEPBandPlot.h:107
TGraph * m_b_band_graph_2sigma
The b band 2 sigma.
Definition: LEPBandPlot.h:98
TGraph * m_data_line_graph
The data line.
Definition: LEPBandPlot.h:89
TLine * m_zero_line
The line at 0.
Definition: LEPBandPlot.h:104
TGraph * m_b_line_graph
The b line.
Definition: LEPBandPlot.h:92

Member Function Documentation

void LEPBandPlot::draw ( const char *  options = "")
virtual

Draw on canvas.

Implements StatisticalPlot.

Definition at line 221 of file LEPBandPlot.cc.

References StatisticalPlot::getCanvas(), m_b_band_graph_1sigma, m_b_band_graph_2sigma, m_b_line_graph, m_data_line_graph, m_legend, m_sb_line_graph, m_zero_line, NULL, and StatisticalPlot::setCanvas().

221  {
222 
223  setCanvas(new TCanvas(GetName(),GetTitle()));
224  getCanvas()->cd();
225 
226  getCanvas()->SetGridx();
227  getCanvas()->SetGridy();
228 
229  TString opt(options);
230  // Bands
231  if (opt.Contains("4")==0){
232  m_b_band_graph_2sigma->Draw("A3");
233  m_b_band_graph_1sigma->Draw("3");
234  }
235  else{
236  m_b_band_graph_2sigma->Draw("A4");
237  m_b_band_graph_1sigma->Draw("4");
238  }
239 
240  // Lines
241  if (opt.Contains("4")==0){
242  m_b_line_graph->Draw("L");
243  m_sb_line_graph->Draw("L");
244  }
245  else{
246  m_b_line_graph->Draw("C");
247  m_sb_line_graph->Draw("C");
248  }
249 
250  if (m_data_line_graph!=NULL)
251  m_data_line_graph->Draw("L");
252 
253  m_zero_line->Draw("Same");
254 
255  // Legend
256  m_legend->Draw("Same");
257 
258  }
void setCanvas(TCanvas *new_canvas)
Set the canvas.
TGraph * m_b_band_graph_1sigma
The b band 1 sigma.
Definition: LEPBandPlot.h:95
#define NULL
Definition: scimark2.h:8
TGraph * m_sb_line_graph
The sb line.
Definition: LEPBandPlot.h:101
TLegend * m_legend
The legend.
Definition: LEPBandPlot.h:107
TGraph * m_b_band_graph_2sigma
The b band 2 sigma.
Definition: LEPBandPlot.h:98
TGraph * m_data_line_graph
The data line.
Definition: LEPBandPlot.h:89
TLine * m_zero_line
The line at 0.
Definition: LEPBandPlot.h:104
TGraph * m_b_line_graph
The b line.
Definition: LEPBandPlot.h:92
TCanvas * getCanvas()
Get the canvas.
void LEPBandPlot::dumpToFile ( const char *  RootFileName,
const char *  options 
)
virtual

All the objects are written to rootfile.

Implements StatisticalPlot.

Definition at line 262 of file LEPBandPlot.cc.

References m_b_band_graph_1sigma, m_b_band_graph_2sigma, m_b_line_graph, m_data_line_graph, m_legend, m_sb_line_graph, and interpolateCardsSimple::ofile.

262  {
263 
264  TFile ofile(RootFileName,options);
265  ofile.cd();
266 
267  // Bands
268  m_b_band_graph_2sigma->Write("bkg_band_2sigma");
269  m_b_band_graph_1sigma->Draw("bkg_band_1sigma");
270 
271  // Lines
272  m_b_line_graph->Draw("bkg_line");
273  m_sb_line_graph->Draw("sigbkg_line");
274  if (m_data_line_graph)
275  m_data_line_graph->Draw("observed_line");
276 
277  // Legend
278  m_legend->Draw("IamTheLegend");
279 
280  ofile.Close();
281 
282  }
TGraph * m_b_band_graph_1sigma
The b band 1 sigma.
Definition: LEPBandPlot.h:95
TGraph * m_sb_line_graph
The sb line.
Definition: LEPBandPlot.h:101
TLegend * m_legend
The legend.
Definition: LEPBandPlot.h:107
TGraph * m_b_band_graph_2sigma
The b band 2 sigma.
Definition: LEPBandPlot.h:98
TGraph * m_data_line_graph
The data line.
Definition: LEPBandPlot.h:89
TGraph * m_b_line_graph
The b line.
Definition: LEPBandPlot.h:92
void LEPBandPlot::print ( const char *  options = "")
virtual

Print the relevant information.

Implements StatisticalPlot.

Definition at line 286 of file LEPBandPlot.cc.

References gather_cfg::cout.

286  {
287  std::cout << "\nLEPBandPlot object " << GetName() << ":\n";
288  }
tuple cout
Definition: gather_cfg.py:121
void LEPBandPlot::setTitle ( const char *  title)

Set the title of the plot.

The title is here set only for the plot of the 2sigma band plot. Indeed its axes will be the only one to be drawn.

Definition at line 215 of file LEPBandPlot.cc.

References m_b_band_graph_2sigma.

215  {
216  m_b_band_graph_2sigma->SetTitle(title);
217  }
TGraph * m_b_band_graph_2sigma
The b band 2 sigma.
Definition: LEPBandPlot.h:98
void LEPBandPlot::setXaxisTitle ( const char *  title)

Set the title of the x axis.

The title of the x axis is here set only for the plot of the 2sigma band plot. Indeed its axes will be the only one to be drawn.

Definition at line 205 of file LEPBandPlot.cc.

References m_b_band_graph_2sigma.

205  {
206  m_b_band_graph_2sigma->GetXaxis()->SetTitle(title);
207  }
TGraph * m_b_band_graph_2sigma
The b band 2 sigma.
Definition: LEPBandPlot.h:98

Member Data Documentation

TGraph* LEPBandPlot::m_b_band_graph_1sigma
private

The b band 1 sigma.

Definition at line 95 of file LEPBandPlot.h.

Referenced by draw(), dumpToFile(), LEPBandPlot(), and ~LEPBandPlot().

TGraph* LEPBandPlot::m_b_band_graph_2sigma
private

The b band 2 sigma.

Definition at line 98 of file LEPBandPlot.h.

Referenced by draw(), dumpToFile(), LEPBandPlot(), setTitle(), setXaxisTitle(), and ~LEPBandPlot().

TGraph* LEPBandPlot::m_b_line_graph
private

The b line.

Definition at line 92 of file LEPBandPlot.h.

Referenced by draw(), dumpToFile(), LEPBandPlot(), and ~LEPBandPlot().

TGraph* LEPBandPlot::m_data_line_graph
private

The data line.

Definition at line 89 of file LEPBandPlot.h.

Referenced by draw(), dumpToFile(), LEPBandPlot(), and ~LEPBandPlot().

TLegend* LEPBandPlot::m_legend
private

The legend.

Definition at line 107 of file LEPBandPlot.h.

Referenced by draw(), dumpToFile(), LEPBandPlot(), and ~LEPBandPlot().

TGraph* LEPBandPlot::m_sb_line_graph
private

The sb line.

Definition at line 101 of file LEPBandPlot.h.

Referenced by draw(), dumpToFile(), LEPBandPlot(), and ~LEPBandPlot().

TLine* LEPBandPlot::m_zero_line
private

The line at 0.

Definition at line 104 of file LEPBandPlot.h.

Referenced by draw(), LEPBandPlot(), and ~LEPBandPlot().