

|
|
|
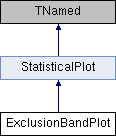
ExclusionBandPlot: plot a la tevatron for SM eclusion in function of mass. More...
#include <ExclusionBandPlot.h>
Public Member Functions | |
| void | draw (const char *options="") |
| Draw on canvas. More... | |
| void | dumpToFile (const char *RootFileName, const char *options) |
| All the objects are written to rootfile. More... | |
| ExclusionBandPlot (const char *name, const char *title, const int n_points, double *x_vals, double *y_vals, double *y_up_bars1, double *y_down_bars1, double *y_up_bars2, double *y_down_bars2) | |
| Constructor. More... | |
| void | print (const char *options="") |
| Print the relevant information. More... | |
| void | setTitle (const char *title) |
| Set the title of the plot. More... | |
| void | setXaxisTitle (const char *title) |
| Set the title of the x axis. More... | |
| void | setYaxisTitle (const char *title) |
| Set the title of the x axis. More... | |
| ~ExclusionBandPlot () | |
| Destructor. More... | |
 Public Member Functions inherited from StatisticalPlot Public Member Functions inherited from StatisticalPlot | |
| void | dumpToImage (const char *filename) |
| Write an image on disk. More... | |
| TCanvas * | getCanvas () |
| Get the canvas. More... | |
| bool | is_verbose () |
| get the verbosity More... | |
| void | setCanvas (TCanvas *new_canvas) |
| Set the canvas. More... | |
| void | setVerbosity (bool verbosity) |
| Set the verbosity. More... | |
| StatisticalPlot (const char *name, const char *title, bool verbosity=true) | |
| Constructor. More... | |
| ~StatisticalPlot () | |
| Destructor. More... | |
Private Attributes | |
| TLegend * | m_legend |
| The legend. More... | |
| TLine * | m_one_line |
| The line at 1. More... | |
| TGraph * | m_y_band_graph_1sigma |
| The band 1 sigma. More... | |
| TGraph * | m_y_band_graph_2sigma |
| The band 2 sigma. More... | |
| TGraph * | m_y_line_graph |
| The line. More... | |
ExclusionBandPlot: plot a la tevatron for SM eclusion in function of mass.
Yet another band plot, this time for sm exclusion, following the examples of the Tevatron Higgs WG.
Definition at line 29 of file ExclusionBandPlot.h.
| ExclusionBandPlot::ExclusionBandPlot | ( | const char * | name, |
| const char * | title, | ||
| const int | n_points, | ||
| double * | x_vals, | ||
| double * | y_vals, | ||
| double * | y_up_bars1, | ||
| double * | y_down_bars1, | ||
| double * | y_up_bars2, | ||
| double * | y_down_bars2 | ||
| ) |
Constructor.
Definition at line 22 of file ExclusionBandPlot.cc.
References i, m_legend, m_one_line, m_y_band_graph_1sigma, m_y_band_graph_2sigma, and m_y_line_graph.
| ExclusionBandPlot::~ExclusionBandPlot | ( | ) |
Destructor.
Definition at line 103 of file ExclusionBandPlot.cc.
References m_legend, m_one_line, m_y_band_graph_1sigma, m_y_band_graph_2sigma, and m_y_line_graph.
|
virtual |
Draw on canvas.
Implements StatisticalPlot.
Definition at line 148 of file ExclusionBandPlot.cc.
References StatisticalPlot::getCanvas(), m_legend, m_one_line, m_y_band_graph_1sigma, m_y_band_graph_2sigma, m_y_line_graph, and StatisticalPlot::setCanvas().
|
virtual |
All the objects are written to rootfile.
Implements StatisticalPlot.
Definition at line 184 of file ExclusionBandPlot.cc.
References m_legend, m_y_band_graph_1sigma, m_y_band_graph_2sigma, m_y_line_graph, and interpolateCardsSimple::ofile.
|
virtual |
Print the relevant information.
Implements StatisticalPlot.
Definition at line 205 of file ExclusionBandPlot.cc.
References gather_cfg::cout.
| void ExclusionBandPlot::setTitle | ( | const char * | title | ) |
Set the title of the plot.
The title is here set only for the plot of the 2sigma band plot. Indeed its axes will be the only one to be drawn.
Definition at line 142 of file ExclusionBandPlot.cc.
References m_y_band_graph_2sigma.
| void ExclusionBandPlot::setXaxisTitle | ( | const char * | title | ) |
Set the title of the x axis.
The title of the x axis is here set only for the plot of the 2sigma band plot. Indeed its axes will be the only one to be drawn.
Definition at line 122 of file ExclusionBandPlot.cc.
References m_y_band_graph_2sigma.
| void ExclusionBandPlot::setYaxisTitle | ( | const char * | title | ) |
Set the title of the x axis.
The title of the y axis is here set only for the plot of the 2sigma band plot. Indeed its axes will be the only one to be drawn.
Definition at line 132 of file ExclusionBandPlot.cc.
References m_y_band_graph_2sigma.
|
private |
The legend.
Definition at line 80 of file ExclusionBandPlot.h.
Referenced by draw(), dumpToFile(), ExclusionBandPlot(), and ~ExclusionBandPlot().
|
private |
The line at 1.
Definition at line 77 of file ExclusionBandPlot.h.
Referenced by draw(), ExclusionBandPlot(), and ~ExclusionBandPlot().
|
private |
The band 1 sigma.
Definition at line 71 of file ExclusionBandPlot.h.
Referenced by draw(), dumpToFile(), ExclusionBandPlot(), and ~ExclusionBandPlot().
|
private |
The band 2 sigma.
Definition at line 74 of file ExclusionBandPlot.h.
Referenced by draw(), dumpToFile(), ExclusionBandPlot(), setTitle(), setXaxisTitle(), setYaxisTitle(), and ~ExclusionBandPlot().
|
private |
The line.
Definition at line 68 of file ExclusionBandPlot.h.
Referenced by draw(), dumpToFile(), ExclusionBandPlot(), and ~ExclusionBandPlot().
 1.8.5
1.8.5

