

|
 |

Classes | |
| class | Sample |
| nested class Sample More... | |
| class | Samples |
| end Sample More... | |
Public Member Functions | |
| def | __init__ |
| def | __repr__ |
| def | Path |
| def | sample |
| end nested class More... | |
| def | subsample |
| def | SVG |
Public Attributes | |
| attr | |
| f | |
| high | |
| last_samples | |
| loop | |
| low | |
Static Public Attributes | |
| dictionary | defaults = {} |
| int | discontinuity_limit = 5 |
| float | linearity_limit = 0.05 |
| random_sampling = True | |
| int | recursion_limit = 15 |
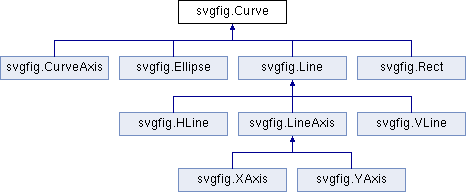
Draws a parametric function as a path.

Curve(f, low, high, loop, attribute=value)

f                      required         a Python callable or string in
                                        the form "f(t), g(t)"
low, high              required         left and right endpoints
loop                   default=False    if True, connect the endpoints
attribute=value pairs  keyword list     SVG attributes
| def svgfig.Curve.__repr__ | ( | self | ) |
Definition at line 1515 of file svgfig.py.
References svgfig.SVG.attr, svgfig.Path.attr, svgfig.Curve.attr, svgfig.Curve.f, svgfig.Curve.high, and svgfig.Curve.low.
Apply the transformation "trans" and return a Path object in
global coordinates.  If local=True, return a Path in local coordinates
(which must be transformed again).
Definition at line 1653 of file svgfig.py.
References svgfig.SVG.attr, svgfig.Path.attr, svgfig.Curve.attr, svgfig.Curve.f, svgfig.funcRtoR2(), svgfig.Curve.last_samples, svgfig.Curve.loop, dirstructure.CompInfo.sample, CastorLedAnalysis.sample, HcalLedAnalysis.sample, CastorPedestalAnalysis.sample, HcalPedestalAnalysis.sample, svgfig.Curve.sample(), and svgfig.totrans().
Referenced by svgfig.Curve.SVG(), svgfig.Poly.SVG(), svgfig.Line.SVG(), svgfig.Rect.SVG(), and svgfig.Ellipse.SVG().
| def svgfig.Curve.sample | ( | self, | |
trans = None |
|||
| ) |
end nested class
Adaptive-sampling algorithm that chooses the best sample points
for a parametric curve between two endpoints and detects
discontinuities.  Called by SVG().
Definition at line 1575 of file svgfig.py.
References abs, svgfig.Curve.f, svgfig.Curve.high, svgfig.Curve.linearity_limit, svgfig.Curve.low, svgfig.Curve.recursion_limit, and svgfig.Curve.subsample().
Referenced by svgfig.Curve.Path().
| def svgfig.Curve.subsample | ( | self, | |
| left, | |||
| right, | |||
| depth, | |||
trans = None |
|||
| ) |
Part of the adaptive-sampling algorithm that chooses the best
sample points.  Called by sample().
Definition at line 1618 of file svgfig.py.
References abs, svgfig.Curve.discontinuity_limit, svgfig.Curve.f, svgfig.Curve.linearity_limit, svgfig.Curve.random_sampling, svgfig.Curve.recursion_limit, and svgfig.Curve.subsample().
Referenced by svgfig.Curve.sample(), and svgfig.Curve.subsample().
| def svgfig.Curve.SVG | ( | self, | |
trans = None |
|||
| ) |
Apply the transformation "trans" and return an SVG object.
Definition at line 1649 of file svgfig.py.
References SiPixelHistoPlotter::PlotParameter.Path, SiStripHistoPlotter::PlotParameter.Path, and svgfig.Curve.Path().
| svgfig.Curve.attr |
Definition at line 1524 of file svgfig.py.
Referenced by svgfig.Curve.__repr__(), svgfig.Poly.__repr__(), svgfig.Text.__repr__(), svgfig.TextGlobal.__repr__(), svgfig.Dots.__repr__(), svgfig.Line.__repr__(), svgfig.LineGlobal.__repr__(), svgfig.VLine.__repr__(), svgfig.HLine.__repr__(), svgfig.Rect.__repr__(), svgfig.Ellipse.__repr__(), svgfig.Ticks.__repr__(), svgfig.CurveAxis.__repr__(), svgfig.LineAxis.__repr__(), svgfig.XAxis.__repr__(), svgfig.YAxis.__repr__(), svgfig.Axes.__repr__(), svgfig.HGrid.__repr__(), svgfig.VGrid.__repr__(), svgfig.Grid.__repr__(), svgfig.Curve.Path(), svgfig.Poly.Path(), svgfig.Rect.Path(), svgfig.Text.SVG(), svgfig.TextGlobal.SVG(), svgfig.LineGlobal.SVG(), svgfig.Axes.SVG(), svgfig.XErrorBars.SVG(), and svgfig.YErrorBars.SVG().
|
static |
Definition at line 1513 of file svgfig.py.
Referenced by svgfig.Curve.subsample().
| svgfig.Curve.f |
Definition at line 1519 of file svgfig.py.
Referenced by svgfig.Curve.__repr__(), svgfig.Ticks.__repr__(), svgfig.CurveAxis.__repr__(), Vispa.Views.RootCanvasView.RootCanvasView.createGraph(), Vispa.Views.RootCanvasView.RootCanvasView.createLegoPlot(), svgfig.Ticks.orient_tickmark(), svgfig.Curve.Path(), svgfig.Curve.sample(), svgfig.Curve.subsample(), and svgfig.LineAxis.SVG().
| svgfig.Curve.high |
Definition at line 1521 of file svgfig.py.
Referenced by svgfig.Curve.__repr__(), svgfig.Ticks.__repr__(), svgfig.CurveAxis.__repr__(), svgfig.HGrid.__repr__(), svgfig.VGrid.__repr__(), svgfig.Ticks.compute_logminiticks(), svgfig.Ticks.compute_logticks(), svgfig.Ticks.compute_miniticks(), svgfig.Ticks.compute_ticks(), svgfig.Ticks.interpret(), svgfig.Ticks.orient_tickmark(), svgfig.Ticks.regular_miniticks(), and svgfig.Curve.sample().
| svgfig.Curve.last_samples |
Definition at line 1613 of file svgfig.py.
Referenced by svgfig.Curve.Path().
|
static |
Definition at line 1512 of file svgfig.py.
Referenced by svgfig.Curve.sample(), and svgfig.Curve.subsample().
| svgfig.Curve.loop |
Definition at line 1522 of file svgfig.py.
Referenced by svgfig.Poly.__repr__(), svgfig.Curve.Path(), and svgfig.Poly.Path().
| svgfig.Curve.low |
Definition at line 1520 of file svgfig.py.
Referenced by svgfig.Curve.__repr__(), svgfig.Ticks.__repr__(), svgfig.CurveAxis.__repr__(), svgfig.HGrid.__repr__(), svgfig.VGrid.__repr__(), svgfig.Ticks.compute_logminiticks(), svgfig.Ticks.compute_logticks(), svgfig.Ticks.compute_miniticks(), svgfig.Ticks.compute_ticks(), svgfig.Ticks.interpret(), svgfig.Ticks.orient_tickmark(), svgfig.Ticks.regular_miniticks(), and svgfig.Curve.sample().
|
static |
Definition at line 1510 of file svgfig.py.
Referenced by svgfig.Curve.subsample().
|
static |
Definition at line 1511 of file svgfig.py.
Referenced by svgfig.Curve.sample(), and svgfig.Curve.subsample().
 1.8.5
1.8.5