

|
 |

Classes | |
| class | Sample |
| nested class Sample More... | |
| class | Samples |
| end Sample More... | |
Public Member Functions | |
| def | __init__ (self, f, low, high, loop=False, **attr) |
| def | __repr__ (self) |
| def | Path (self, trans=None, local=False) |
| def | sample (self, trans=None) |
| end nested class More... | |
| def | subsample (self, left, right, depth, trans=None) |
| def | SVG (self, trans=None) |
Public Attributes | |
| attr | |
| f | |
| high | |
| last_samples | |
| loop | |
| low | |
Static Public Attributes | |
| dictionary | defaults = {} |
| int | discontinuity_limit = 5. |
| float | linearity_limit = 0.05 |
| bool | random_sampling = True |
| int | recursion_limit = 15 |
Draws a parametric function as a path.

Curve(f, low, high, loop, attribute=value)

f                      required         a Python callable or string in
                                        the form "f(t), g(t)"
low, high              required         left and right endpoints
loop                   default=False    if True, connect the endpoints
attribute=value pairs  keyword list     SVG attributes
| def svgfig.Curve.__init__ | ( | self, | |
| f, | |||
| low, | |||
| high, | |||
loop = False, |
|||
| ** | attr | ||
| ) |
| def svgfig.Curve.__repr__ | ( | self | ) |
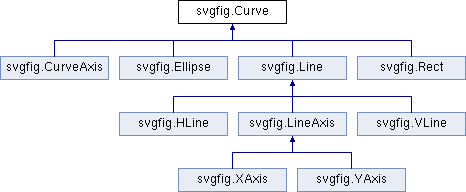
Reimplemented in svgfig.YAxis, svgfig.XAxis, svgfig.LineAxis, svgfig.CurveAxis, svgfig.Ellipse, svgfig.Rect, svgfig.HLine, svgfig.VLine, and svgfig.Line.
Definition at line 1516 of file svgfig.py.
References svgfig.SVG.attr, svgfig.Path.attr, svgfig.Curve.attr, hippyaddtobaddatafiles.KeepWhileOpenFile.f, svgfig.Curve.f, svgfig.Curve.high, and svgfig.Curve.low.
Referenced by data_sources.json_file.__str__().
Apply the transformation "trans" and return a Path object in
global coordinates.  If local=True, return a Path in local coordinates
(which must be transformed again).
Reimplemented in svgfig.Ellipse, svgfig.Rect, svgfig.HLine, svgfig.VLine, and svgfig.Line.
Definition at line 1654 of file svgfig.py.
References svgfig.SVG.attr, svgfig.Path.attr, svgfig.Curve.attr, hippyaddtobaddatafiles.KeepWhileOpenFile.f, svgfig.Curve.f, svgfig.funcRtoR2(), svgfig.Curve.last_samples, svgfig.Curve.loop, CastorLedAnalysis.sample, HcalLedAnalysis.sample, CastorPedestalAnalysis.sample, HcalPedestalAnalysis.sample, svgfig.Curve.sample(), and svgfig.totrans().
Referenced by svgfig.Curve.SVG(), svgfig.Poly.SVG(), svgfig.Line.SVG(), svgfig.Rect.SVG(), and svgfig.Ellipse.SVG().
| def svgfig.Curve.sample | ( | self, | |
trans = None |
|||
| ) |
end nested class
Adaptive-sampling algorithm that chooses the best sample points
for a parametric curve between two endpoints and detects
discontinuities.  Called by SVG().
Definition at line 1576 of file svgfig.py.
References funct.abs(), hippyaddtobaddatafiles.KeepWhileOpenFile.f, svgfig.Curve.f, dqmMemoryStats.float, svgfig.Curve.high, svgfig.Curve.linearity_limit, svgfig.Curve.low, svgfig.Curve.recursion_limit, and svgfig.Curve.subsample().
Referenced by svgfig.Curve.Path().
| def svgfig.Curve.subsample | ( | self, | |
| left, | |||
| right, | |||
| depth, | |||
trans = None |
|||
| ) |
Part of the adaptive-sampling algorithm that chooses the best
sample points.  Called by sample().
Definition at line 1619 of file svgfig.py.
References funct.abs(), svgfig.Curve.discontinuity_limit, hippyaddtobaddatafiles.KeepWhileOpenFile.f, svgfig.Curve.f, svgfig.Curve.linearity_limit, svgfig.Curve.random_sampling, svgfig.Curve.recursion_limit, and svgfig.Curve.subsample().
Referenced by svgfig.Curve.sample(), and svgfig.Curve.subsample().
| def svgfig.Curve.SVG | ( | self, | |
trans = None |
|||
| ) |
Apply the transformation "trans" and return an SVG object.
Reimplemented in svgfig.YAxis, svgfig.XAxis, svgfig.LineAxis, svgfig.CurveAxis, svgfig.Ellipse, svgfig.Rect, and svgfig.Line.
Definition at line 1650 of file svgfig.py.
References SiStripHistoPlotter::PlotParameter.Path, Json::PathArgument.Path, and svgfig.Curve.Path().
| svgfig.Curve.attr |
Definition at line 1525 of file svgfig.py.
Referenced by svgfig.Curve.__repr__(), svgfig.Poly.__repr__(), svgfig.Text.__repr__(), svgfig.TextGlobal.__repr__(), svgfig.Dots.__repr__(), svgfig.Line.__repr__(), svgfig.LineGlobal.__repr__(), svgfig.VLine.__repr__(), svgfig.HLine.__repr__(), svgfig.Rect.__repr__(), svgfig.Ellipse.__repr__(), svgfig.Ticks.__repr__(), svgfig.CurveAxis.__repr__(), svgfig.LineAxis.__repr__(), svgfig.XAxis.__repr__(), svgfig.YAxis.__repr__(), svgfig.Axes.__repr__(), svgfig.HGrid.__repr__(), svgfig.VGrid.__repr__(), svgfig.Grid.__repr__(), svgfig.Curve.Path(), svgfig.Poly.Path(), svgfig.Rect.Path(), svgfig.Text.SVG(), svgfig.TextGlobal.SVG(), svgfig.LineGlobal.SVG(), svgfig.Axes.SVG(), svgfig.XErrorBars.SVG(), and svgfig.YErrorBars.SVG().
|
static |
Definition at line 1510 of file svgfig.py.
Referenced by tree.Tree.reset(), and tree.Tree.var().
|
static |
Definition at line 1514 of file svgfig.py.
Referenced by svgfig.Curve.subsample().
| svgfig.Curve.f |
Definition at line 1520 of file svgfig.py.
Referenced by svgfig.Curve.__repr__(), svgfig.Ticks.__repr__(), svgfig.CurveAxis.__repr__(), ztail.Decoder.follow(), ztail.Decoder.initial_synchronize(), svgfig.Ticks.orient_tickmark(), svgfig.Curve.Path(), DQMIO2histo.DQMIO.print_index(), svgfig.Curve.sample(), svgfig.Curve.subsample(), svgfig.LineAxis.SVG(), electronCompare.flushfile.write(), electronStore.flushfile.write(), and DQMIO2histo.DQMIO.write_to_file().
| svgfig.Curve.high |
Definition at line 1522 of file svgfig.py.
Referenced by svgfig.Curve.__repr__(), svgfig.Ticks.__repr__(), svgfig.CurveAxis.__repr__(), svgfig.HGrid.__repr__(), svgfig.VGrid.__repr__(), svgfig.Ticks.compute_logminiticks(), svgfig.Ticks.compute_logticks(), svgfig.Ticks.compute_miniticks(), svgfig.Ticks.compute_ticks(), svgfig.Ticks.interpret(), svgfig.Ticks.orient_tickmark(), svgfig.Ticks.regular_miniticks(), and svgfig.Curve.sample().
| svgfig.Curve.last_samples |
Definition at line 1614 of file svgfig.py.
Referenced by svgfig.Curve.Path().
|
static |
Definition at line 1513 of file svgfig.py.
Referenced by svgfig.Curve.sample(), and svgfig.Curve.subsample().
| svgfig.Curve.loop |
Definition at line 1523 of file svgfig.py.
Referenced by svgfig.Poly.__repr__(), svgfig.Curve.Path(), and svgfig.Poly.Path().
| svgfig.Curve.low |
Definition at line 1521 of file svgfig.py.
Referenced by svgfig.Curve.__repr__(), svgfig.Ticks.__repr__(), svgfig.CurveAxis.__repr__(), svgfig.HGrid.__repr__(), svgfig.VGrid.__repr__(), svgfig.Ticks.compute_logminiticks(), svgfig.Ticks.compute_logticks(), svgfig.Ticks.compute_miniticks(), svgfig.Ticks.compute_ticks(), svgfig.Ticks.interpret(), svgfig.Ticks.orient_tickmark(), svgfig.Ticks.regular_miniticks(), and svgfig.Curve.sample().
|
static |
Definition at line 1511 of file svgfig.py.
Referenced by svgfig.Curve.subsample().
|
static |
Definition at line 1512 of file svgfig.py.
Referenced by svgfig.Curve.sample(), and svgfig.Curve.subsample().
 1.8.16